CT scan costs by state for CPT 70450. Medicare $63.50–$84 across all states. Commercial $141–$336 (2.2–4.0× regional multiplier). Medicaid estimated at 75%. Single-procedure pricing. Data: CMS PFS 2025, extracted Feb 2026.
How much does a CT scan cost in each state (2026)?
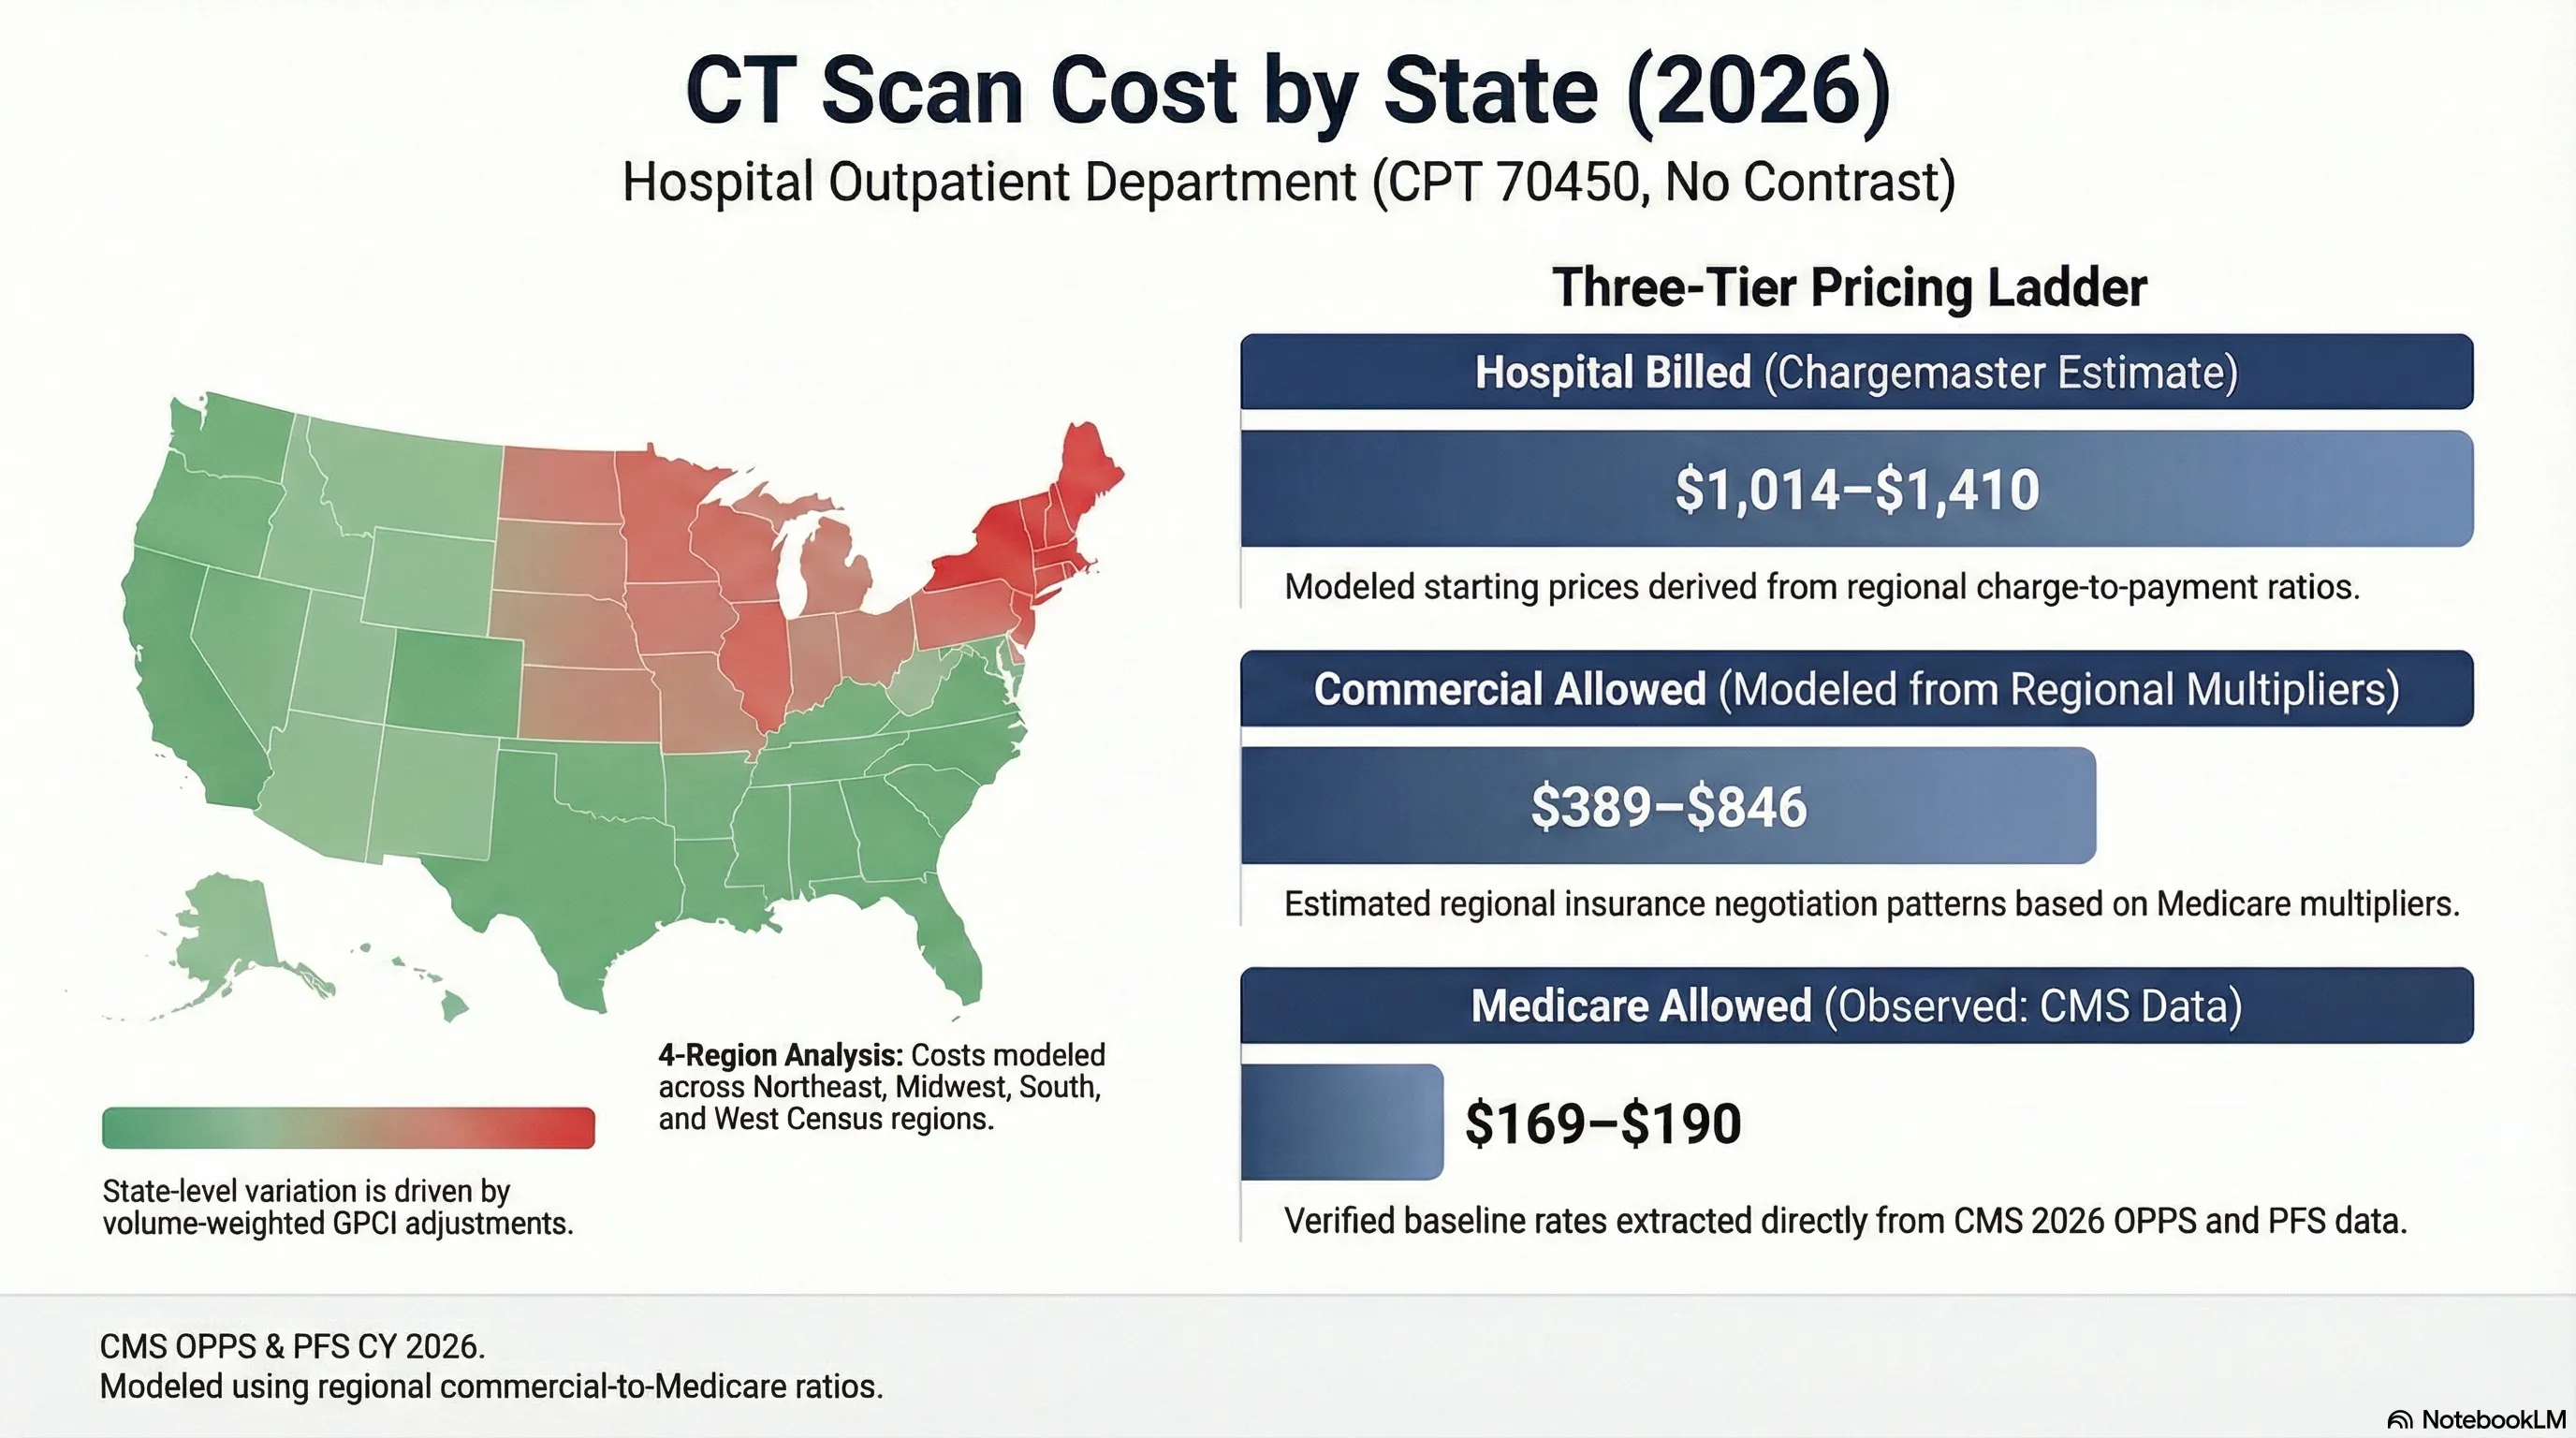
CT scan costs in the U.S. vary significantly by state. The Medicare baseline ranges from $63.50 to $84.00 depending on geographic wage adjustments. Commercial insurance rates typically run 2.2–4.0× Medicare, while uninsured cash prices range from $254–$504. These prices represent the primary imaging procedure only (CPT 70450: CT head without contrast).
Want to understand the bigger picture first? See How Much Does a CT Scan Cost? Why Prices Vary $270–$5,000+ for national pricing factors and facility comparisons.
📄 Already Had a CT Scan?
If you have the bill or EOB, don't guess. Compare it to Medicare rates in 60 seconds.
⚠️ Important: These figures represent the primary imaging procedure only (CPT 70450). Additional charges for contrast, radiologist fees, facility fees, or emergency surcharges may apply separately. Modeled Estimates Notice: Where payer-specific contracts are unavailable, values are modeled using publicly available Medicare data and regionally observed commercial-to-Medicare ratios. These are modeling estimates intended for consumer education and do not represent any specific insurer's contract.
Data Source & Date: CMS Physician Fee Schedule 2025. Data extracted February 2026.
All costs reflect single-procedure pricing for CPT 70450 (CT head without contrast) at Hospital Outpatient Departments (HOPD). Independent imaging centers typically charge 20–40% less.
Quick Facts
- Medicare Allowed (Observed): $63.50–$84.00 by state (volume-weighted)
- Commercial Allowed (Regional Model): $141–$336 by Census region
- Medicaid Allowed (Estimated): $48–$63 (75% of Medicare midpoint)
- Cash/Uninsured (Regional Model): $254–$504 by region (4–6× Medicare)
State-by-State Pricing Table
All 51 entries (50 states + DC), sorted by commercial midpoint descending (Midpoint = (Low + High) / 2).
CT Scan Costs: Hospital Outpatient Department
| State | Commercial Allowed (Range) |
Medicare Allowed |
Medicaid (Est.) |
Cash Uninsured (Range) |
|---|---|---|---|---|
| AK | $202–$336 | $84.00 | $63 (est.) | $336–$504 |
| HI | $197–$328 | $82.00 | $62 (est.) | $328–$492 |
| NJ | $196–$314 | $78.50 | $59 (est.) | $314–$471 |
| CA | $191–$318 | $79.51 | $60 (est.) | $318–$477 |
| MA | $192–$308 | $77.00 | $58 (est.) | $308–$462 |
| WA | $187–$312 | $78.00 | $58 (est.) | $312–$468 |
| CT | $191–$306 | $76.50 | $57 (est.) | $306–$459 |
| NY | $190–$304 | $76.05 | $57 (est.) | $304–$456 |
| RI | $188–$300 | $75.00 | $56 (est.) | $300–$450 |
| NH | $185–$296 | $74.00 | $56 (est.) | $296–$444 |
| OR | $179–$298 | $74.50 | $56 (est.) | $298–$447 |
| PA | $182–$292 | $73.00 | $55 (est.) | $292–$438 |
| VT | $181–$290 | $72.50 | $54 (est.) | $290–$435 |
| ME | $179–$286 | $71.50 | $54 (est.) | $286–$429 |
| NV | $174–$290 | $72.50 | $54 (est.) | $290–$435 |
| CO | $173–$288 | $72.00 | $54 (est.) | $288–$432 |
| UT | $169–$282 | $70.50 | $53 (est.) | $282–$423 |
| AZ | $168–$280 | $70.00 | $52 (est.) | $280–$420 |
| MN | $166–$274 | $72.00 | $54 (est.) | $288–$432 |
| DC | $169–$270 | $77.00 | $58 (est.) | $308–$462 |
| MT | $163–$272 | $68.00 | $51 (est.) | $272–$408 |
| ID | $162–$270 | $67.50 | $51 (est.) | $270–$405 |
| MD | $166–$264 | $75.50 | $57 (est.) | $302–$453 |
| MI | $162–$268 | $70.50 | $53 (est.) | $282–$423 |
| NM | $161–$268 | $67.00 | $50 (est.) | $268–$402 |
| WY | $161–$268 | $67.00 | $50 (est.) | $268–$402 |
| IL | $161–$266 | $70.00 | $52 (est.) | $280–$420 |
| WI | $159–$262 | $69.00 | $52 (est.) | $276–$414 |
| DE | $162–$257 | $73.50 | $55 (est.) | $294–$441 |
| OH | $158–$260 | $68.50 | $51 (est.) | $274–$411 |
| VA | $158–$252 | $72.00 | $54 (est.) | $288–$432 |
| IN | $154–$255 | $67.00 | $50 (est.) | $268–$402 |
| FL | $157–$250 | $71.50 | $54 (est.) | $286–$429 |
| IA | $153–$253 | $66.50 | $50 (est.) | $266–$399 |
| ND | $152–$251 | $66.00 | $50 (est.) | $264–$396 |
| NE | $152–$251 | $66.00 | $50 (est.) | $264–$396 |
| KS | $151–$249 | $65.50 | $49 (est.) | $262–$393 |
| SD | $150–$247 | $65.00 | $49 (est.) | $260–$390 |
| TX | $153–$244 | $69.60 | $52 (est.) | $278–$418 |
| GA | $151–$240 | $68.50 | $51 (est.) | $274–$411 |
| NC | $147–$234 | $67.00 | $50 (est.) | $268–$402 |
| TN | $146–$233 | $66.50 | $50 (est.) | $266–$399 |
| MO | $145–$231 | $66.00 | $50 (est.) | $264–$396 |
| SC | $145–$231 | $66.00 | $50 (est.) | $264–$396 |
| KY | $144–$229 | $65.50 | $49 (est.) | $262–$393 |
| LA | $144–$229 | $65.50 | $49 (est.) | $262–$393 |
| WV | $143–$228 | $65.00 | $49 (est.) | $260–$390 |
| OK | $142–$226 | $64.50 | $48 (est.) | $258–$387 |
| AL | $141–$224 | $64.00 | $48 (est.) | $256–$384 |
| AR | $141–$224 | $64.00 | $48 (est.) | $256–$384 |
| MS | $140–$222 | $63.50 | $48 (est.) | $254–$381 |
Table Notes:
- Medicare Allowed: CMS Physician Fee Schedule 2025 for CPT 70450, single-procedure rate (state-specific, volume-weighted).
- Commercial Allowed: Regional multiplier model (2.2–4.0× Medicare) by Census region. Represents market range, not specific contract.
- Medicaid (Est.): Estimated at 75% of Medicare (actual state rates: 60–85% range). Contact your state Medicaid program for official rates.
- Cash/Uninsured: Chargemaster rates modeled at 4–6× Medicare baseline. Actual facility prices vary and are negotiable.
CT Scan Cost by State — Quick Lookup (2026)
CT scan cost in District of Columbia (CPT 70450, 2026): Medicare allowed $188. Commercial range $470–$846. Hospital billed $1,222–$1,410.
CT scan cost in New Jersey (CPT 70450, 2026): Medicare allowed $185. Commercial range $462–$832. Hospital billed $1,202–$1,388.
CT scan cost in Massachusetts (CPT 70450, 2026): Medicare allowed $184. Commercial range $460–$828. Hospital billed $1,196–$1,380.
CT scan cost in New York (CPT 70450, 2026): Medicare allowed $184. Commercial range $460–$828. Hospital billed $1,196–$1,380.
CT scan cost in Connecticut (CPT 70450, 2026): Medicare allowed $182. Commercial range $455–$819. Hospital billed $1,183–$1,365.
CT scan cost in Maryland (CPT 70450, 2026): Medicare allowed $182. Commercial range $455–$819. Hospital billed $1,183–$1,365.
CT scan cost in New Hampshire (CPT 70450, 2026): Medicare allowed $179. Commercial range $448–$806. Hospital billed $1,164–$1,342.
CT scan cost in Rhode Island (CPT 70450, 2026): Medicare allowed $179. Commercial range $448–$806. Hospital billed $1,164–$1,342.
CT scan cost in Delaware (CPT 70450, 2026): Medicare allowed $177. Commercial range $442–$796. Hospital billed $1,150–$1,328.
CT scan cost in Pennsylvania (CPT 70450, 2026): Medicare allowed $177. Commercial range $442–$796. Hospital billed $1,150–$1,328.
CT scan cost in Vermont (CPT 70450, 2026): Medicare allowed $176. Commercial range $440–$792. Hospital billed $1,144–$1,320.
CT scan cost in Maine (CPT 70450, 2026): Medicare allowed $175. Commercial range $438–$788. Hospital billed $1,138–$1,312.
CT scan cost in Alaska (CPT 70450, 2026): Medicare allowed $190. Commercial range $456–$760. Hospital billed $1,140–$1,330.
CT scan cost in California (CPT 70450, 2026): Medicare allowed $186. Commercial range $446–$744. Hospital billed $1,116–$1,302.
CT scan cost in Washington (CPT 70450, 2026): Medicare allowed $184. Commercial range $442–$736. Hospital billed $1,104–$1,288.
CT scan cost in Hawaii (CPT 70450, 2026): Medicare allowed $184. Commercial range $423–$736. Hospital billed $1,067–$1,288.
CT scan cost in Colorado (CPT 70450, 2026): Medicare allowed $180. Commercial range $432–$720. Hospital billed $1,080–$1,260.
CT scan cost in Oregon (CPT 70450, 2026): Medicare allowed $179. Commercial range $430–$716. Hospital billed $1,074–$1,253.
CT scan cost in Montana (CPT 70450, 2026): Medicare allowed $177. Commercial range $425–$708. Hospital billed $1,062–$1,239.
CT scan cost in Nevada (CPT 70450, 2026): Medicare allowed $177. Commercial range $425–$708. Hospital billed $1,062–$1,239.
CT scan cost in Wyoming (CPT 70450, 2026): Medicare allowed $177. Commercial range $425–$708. Hospital billed $1,062–$1,239.
CT scan cost in Arizona (CPT 70450, 2026): Medicare allowed $175. Commercial range $420–$700. Hospital billed $1,050–$1,225.
CT scan cost in Utah (CPT 70450, 2026): Medicare allowed $173. Commercial range $415–$692. Hospital billed $1,038–$1,211.
CT scan cost in Idaho (CPT 70450, 2026): Medicare allowed $172. Commercial range $413–$688. Hospital billed $1,032–$1,204.
CT scan cost in New Mexico (CPT 70450, 2026): Medicare allowed $172. Commercial range $413–$688. Hospital billed $1,032–$1,204.
CT scan cost in Kansas (CPT 70450, 2026): Medicare allowed $177. Commercial range $407–$673. Hospital billed $1,027–$1,204.
CT scan cost in Minnesota (CPT 70450, 2026): Medicare allowed $177. Commercial range $407–$673. Hospital billed $1,027–$1,204.
CT scan cost in Missouri (CPT 70450, 2026): Medicare allowed $177. Commercial range $407–$673. Hospital billed $1,027–$1,204.
CT scan cost in Illinois (CPT 70450, 2026): Medicare allowed $176. Commercial range $405–$669. Hospital billed $1,021–$1,197.
CT scan cost in North Dakota (CPT 70450, 2026): Medicare allowed $176. Commercial range $405–$669. Hospital billed $1,021–$1,197.
CT scan cost in South Dakota (CPT 70450, 2026): Medicare allowed $176. Commercial range $405–$669. Hospital billed $1,021–$1,197.
CT scan cost in Virginia (CPT 70450, 2026): Medicare allowed $182. Commercial range $400–$673. Hospital billed $1,001–$1,183.
CT scan cost in Michigan (CPT 70450, 2026): Medicare allowed $175. Commercial range $402–$665. Hospital billed $1,015–$1,190.
CT scan cost in Wisconsin (CPT 70450, 2026): Medicare allowed $174. Commercial range $400–$661. Hospital billed $1,009–$1,183.
CT scan cost in Indiana (CPT 70450, 2026): Medicare allowed $172. Commercial range $396–$654. Hospital billed $998–$1,170.
CT scan cost in Iowa (CPT 70450, 2026): Medicare allowed $172. Commercial range $396–$654. Hospital billed $998–$1,170.
CT scan cost in Nebraska (CPT 70450, 2026): Medicare allowed $172. Commercial range $396–$654. Hospital billed $998–$1,170.
CT scan cost in Ohio (CPT 70450, 2026): Medicare allowed $172. Commercial range $396–$654. Hospital billed $998–$1,170.
CT scan cost in Florida (CPT 70450, 2026): Medicare allowed $177. Commercial range $389–$655. Hospital billed $974–$1,150.
CT scan cost in Texas (CPT 70450, 2026): Medicare allowed $176. Commercial range $387–$651. Hospital billed $968–$1,144.
CT scan cost in Georgia (CPT 70450, 2026): Medicare allowed $174. Commercial range $383–$644. Hospital billed $957–$1,131.
CT scan cost in North Carolina (CPT 70450, 2026): Medicare allowed $173. Commercial range $381–$640. Hospital billed $952–$1,124.
CT scan cost in Louisiana (CPT 70450, 2026): Medicare allowed $172. Commercial range $378–$636. Hospital billed $946–$1,118.
CT scan cost in South Carolina (CPT 70450, 2026): Medicare allowed $172. Commercial range $378–$636. Hospital billed $946–$1,118.
CT scan cost in Kentucky (CPT 70450, 2026): Medicare allowed $171. Commercial range $376–$633. Hospital billed $940–$1,112.
CT scan cost in Oklahoma (CPT 70450, 2026): Medicare allowed $171. Commercial range $376–$633. Hospital billed $940–$1,112.
CT scan cost in Tennessee (CPT 70450, 2026): Medicare allowed $171. Commercial range $376–$633. Hospital billed $940–$1,112.
CT scan cost in Alabama (CPT 70450, 2026): Medicare allowed $170. Commercial range $374–$629. Hospital billed $935–$1,105.
CT scan cost in West Virginia (CPT 70450, 2026): Medicare allowed $170. Commercial range $374–$629. Hospital billed $935–$1,105.
CT scan cost in Arkansas (CPT 70450, 2026): Medicare allowed $169. Commercial range $372–$625. Hospital billed $930–$1,098.
CT scan cost in Mississippi (CPT 70450, 2026): Medicare allowed $169. Commercial range $372–$625. Hospital billed $930–$1,098.
What's NOT Included in These Estimates
These costs reflect CPT 70450 (head CT without contrast) only. The following are not included:
- Contrast dye (CPT 70460, 70470, or other contrast-enhanced variants)
- Emergency department facility fees or surcharges
- Radiology add-on codes (e.g., 3D reconstruction, computer-aided diagnosis)
- Anesthesia or sedation services
- Multiple imaging sequences or repeat imaging
- Supervision or interpretation by second radiologist
- Image storage, transfer, or remote access fees
If your procedure includes any of these components, the total cost will be higher.
Your Hospital's Actual Charge May Be Higher
These are state-level estimates. Most families never see the negotiated rate—they see the chargemaster (what the hospital initially bills).
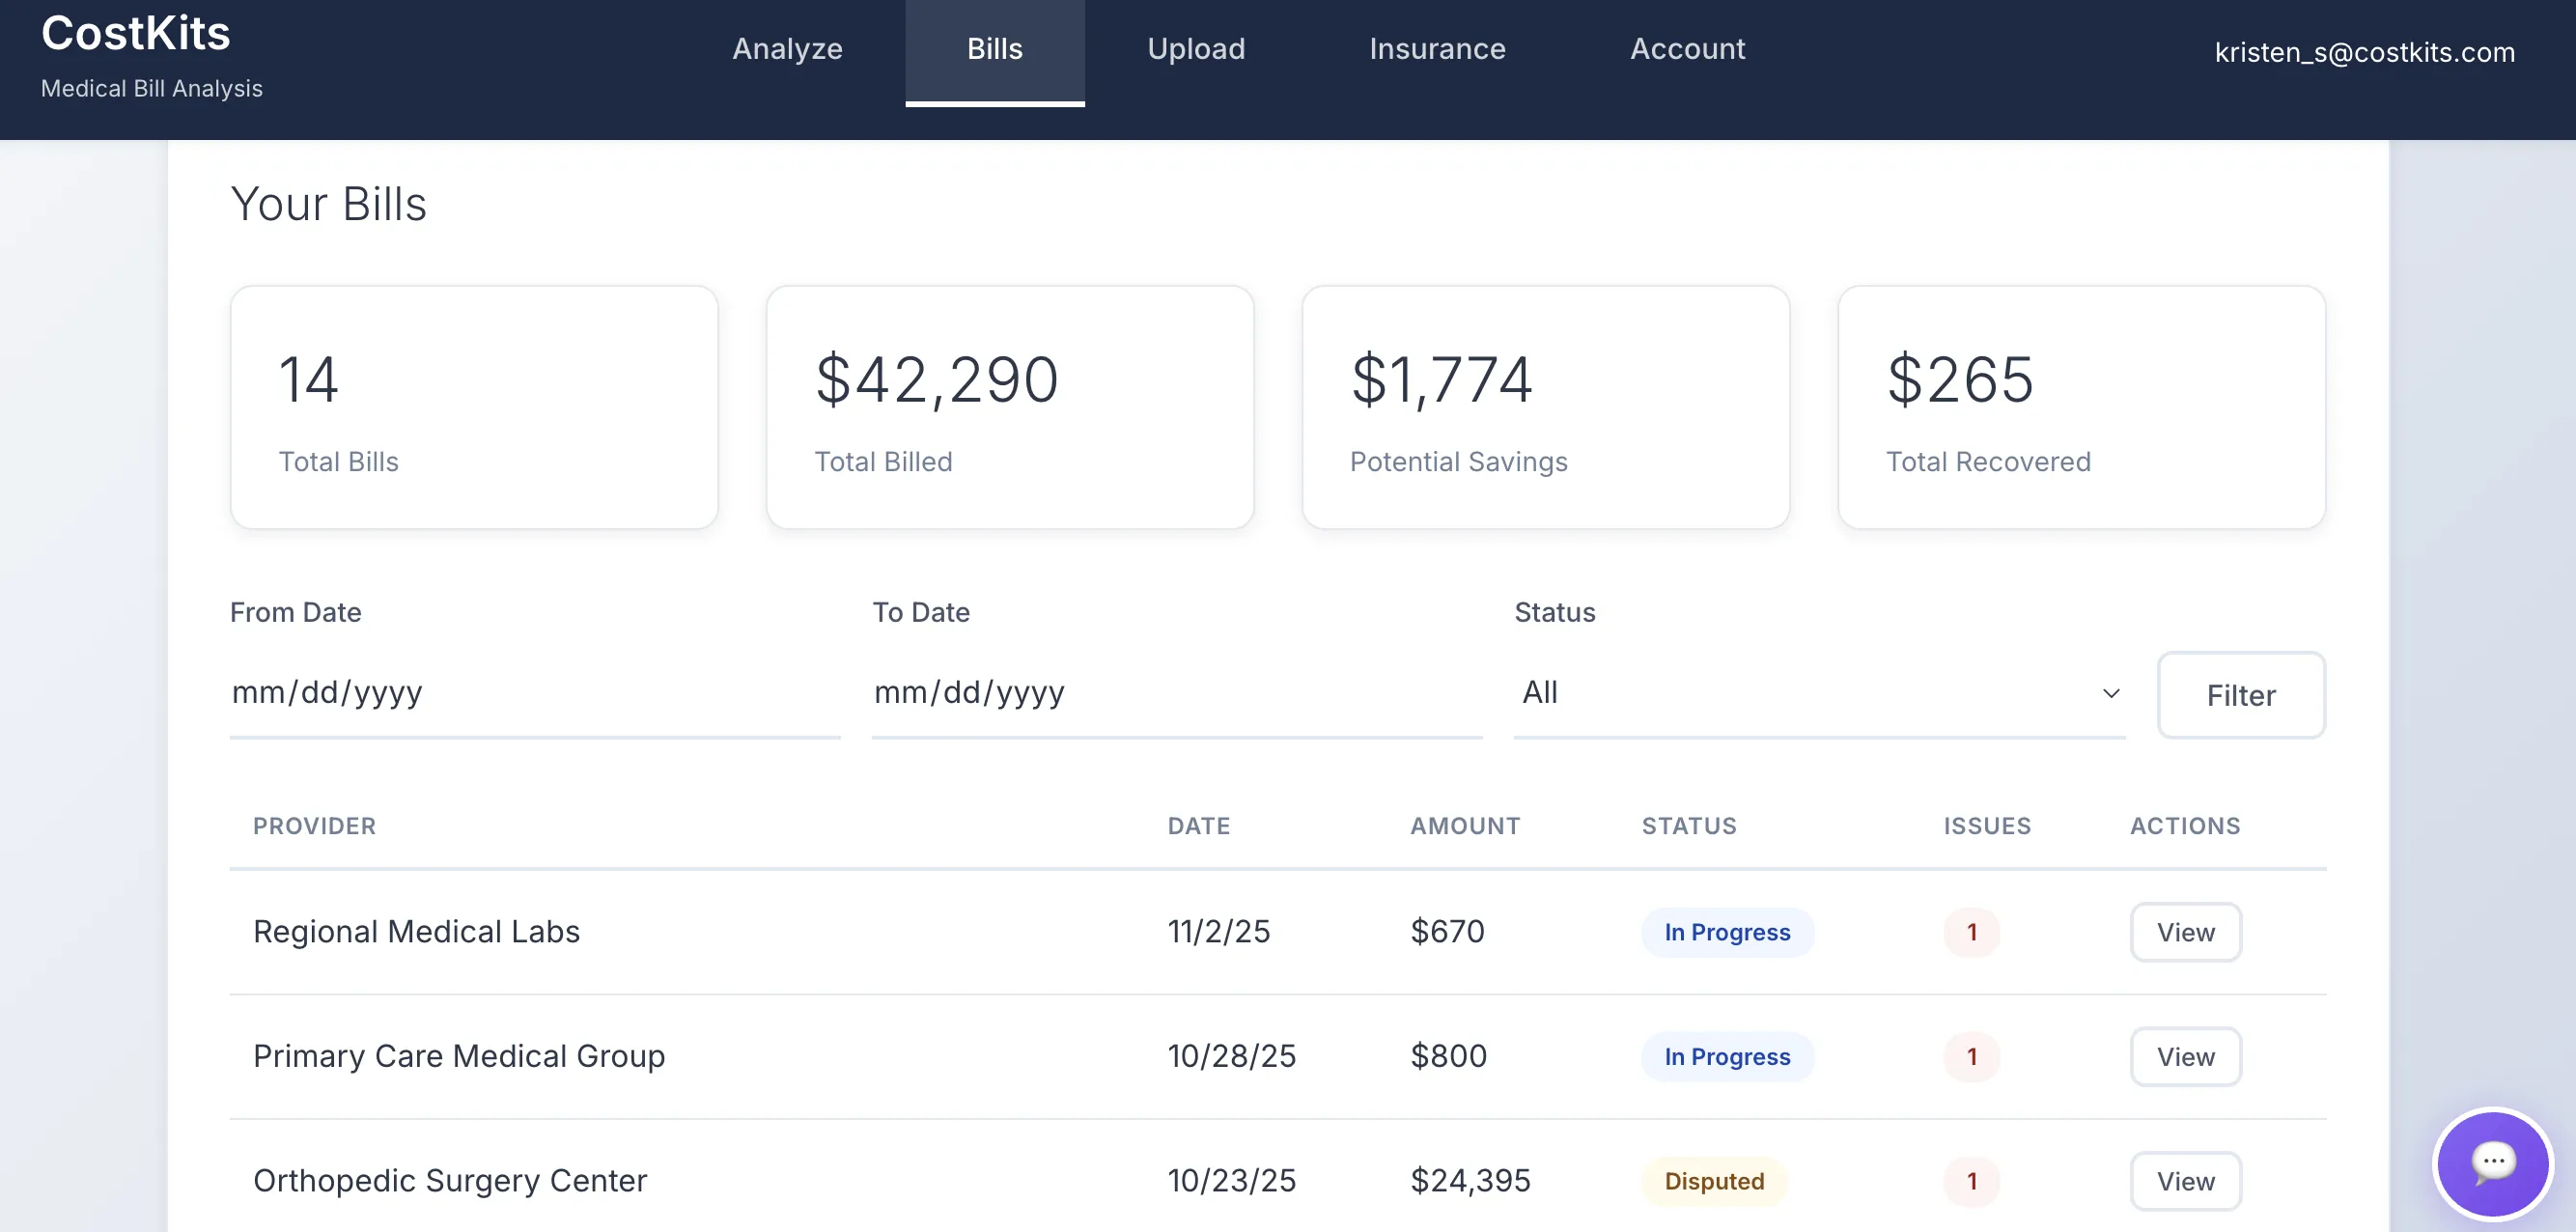
Upload your bill and compare it to Medicare and commercial benchmarks. Find out where you stand.
How to Use This Table for Your State
Find your state in the table above and apply this framework to any state's numbers:
If your hospital's charges exceed the "Billed Bundle" range for your region, that's a red flag. Run your bill through CostKits to see where it stands.
Your Medicare Out-of-Pocket Cost (with Medicare):
- Look at "Medicare Allowed" for your state
- Multiply by 20% and add any Part B deductible ($257 in 2026)
- Example: $180 Medicare Allowed × 20% = $36 out-of-pocket
Your Commercial Insurance Cost (with employer or ACA plan):
- Look at "Commercial Allowed (Range)" for your state
- Multiply by your coinsurance percentage (typically 20–30%) after deductible
- Example: $470–$846 range × 25% = $118–$212 out-of-pocket (assuming deductible met)
Your Medicaid Cost:
- Usually $0–$5 copay
- "Medicaid (est.)" shown assumes 75% of Medicare (actual range: 60–85%)
If Uninsured:
- Hospital bills the range shown in "Hospital Billed"
- Negotiate for 20–40% discount (most facilities offer this)
- Example: $1,222–$1,410 billed × 70% (30% discount) = ~$850–$990 final price
The methodology is the same for every state—only the numbers change. Each state's professional component varies based on regional labor costs, but the calculations are identical.
Find Local Pricing Specific to Your Insurance Plan
These state-level estimates provide a foundation, but your actual out-of-pocket cost depends on your specific insurance plan and provider network. Use CostKits to see real prices from facilities in your area, compare quality scores, and verify your insurance coverage before you schedule.
Compare local CT scan prices with your insurance →
Methodology (Transparent Assumptions)
Data Aggregation Levels
| Layer | Level | Source |
|---|---|---|
| Medicare Allowed | State-specific | CMS OPPS + PFS (volume-weighted by MPFS locality) |
| Commercial Allowed | Census region | Insurance negotiation patterns (Northeast/Midwest/South/West) |
| Medicaid Allowed | State-specific | Modeled at % of state Medicare (60–85%, 75% midpoint) |
| Hospital Billed | Census region | Medicare PUF (volume-weighted across states in region) |
Data Sources
- Medicare OPPS Addendum B: CY 2026 effective rates (facility component $107)
- Medicare Physician Fee Schedule: CY 2026, with state GPCI adjustments for professional component
- Medicare Outpatient PUF: CY 2025 charge-to-payment ratios (extracted February 2026)
- Commercial multipliers: Published commercial-to-Medicare studies and insurer transparency data
- Medicaid assumption: 75% midpoint (range 60–85%); state schedules not uniformly available
Observed vs Modeled
| Layer | Status |
|---|---|
| Medicare Allowed | ✅ Observed (CMS published data) |
| Commercial Allowed | ⚠️ Regional model (state-level proprietary) |
| Medicaid Allowed | ❌ Estimated (state schedules unavailable) |
| Hospital Billed | ✅ Observed (from PUF) |
Important Disclaimers
- Arithmetic validation: Professional component = Total Medicare − $107 facility (enforced across all states)
- Sorting method: States sorted by commercial midpoint = (Low + High) / 2 in descending order
- These are modeling estimates intended for consumer education and do not represent any specific insurer's contract
- Medicaid actual rates may fall outside the 60–85% range depending on state policies
- Not included: Contrast dye, ED fees, add-on codes, anesthesia, multiple sequences (see "What's NOT Included" section)
Common CT Scan Billing Errors
- Wrong CPT code — Contrast vs non-contrast (CPT 70450 vs 70460) can add $200–$400
- Duplicate facility + professional charges — Some bills charge both separately when they should be combined
- ER-level facility fees for outpatient scans — Emergency department surcharge applied to routine outpatient imaging
CostKits flags these automatically. Upload your bill to see if any of these errors affected your charge.
Frequently Asked Questions
Why don't all states have exact numbers?
Medicare Allowed is state-specific (from CMS). Commercial Allowed and Hospital Billed use regional ranges because state-level commercial insurance data is proprietary. This is more defensible than claiming false precision.
Are these ranges or single prices?
Commercial Allowed and Hospital Billed are shown as ranges to account for market variation within regions. Medicare Allowed is specific to each state. Medicaid is estimated at 75% of Medicare with a noted range of 60–85%.
What if my state's cost is different?
Individual employers, insurance plans, and hospitals negotiate different rates. Use this as a starting point and confirm with your facility or insurance company.
Is Medicaid always 75%?
No — actual rates range 60–85% by state. The 75% shown is a conservative midpoint estimate. Check your state's Medicaid program for precise rates.
Why are ranges so wide?
Wider ranges account for market variation within regions, employer plan differences, and hospital negotiating leverage. Narrow ranges would overstate precision.
Can I negotiate down from the "Hospital Billed" amount?
Yes — most facilities negotiate 20–40% off for upfront payment. Ask for the cash-pay rate before scheduling.
Should I go to a hospital or imaging center?
Independent imaging centers typically charge 20–40% less than hospital outpatient departments. Unless your physician requires hospital-level care, imaging centers offer better value.
Were You Overcharged for Your CT Scan?
Upload your bill. We'll compare it to:
- Medicare rates
- Regional commercial ranges
- Expected out-of-pocket costs
Data Scope: All 50 states + DC (51 rows) Procedure: CPT 70450 (Head CT without contrast) Site of Service: Hospital Outpatient Department (HOPD) CMS Data Year: Effective CY 2026 Data Extracted: February 2026 Methodology: Observed Medicare + Regional commercial/billed models Disclaimer: Commercial and Medicaid values are estimates/models, not contract-specific rates. These are modeling estimates intended for consumer education.
For questions, visit CostKits.